MASTER'S RESEARCH · COMPUTER VISION
Classifying brain tumours from MRI.
A complete research prototype that transforms heterogeneous medical images into predictions across four classes through a convolutional model and a usable web interface.
Explore reportINTERACTIVE 3D
Explore the tumour model.
WHY IT MATTERS
A difficult visual problem with real clinical consequences.
Brain and central nervous system tumours are uncommon compared with many cancers, yet their location and heterogeneity make assessment especially demanding. The project explored how computer vision could support image review without replacing specialist judgement.
Global context: IARC Global Cancer Observatory, GLOBOCAN 2022. The prototype is research work and is not a validated medical diagnostic device.
THE CHALLENGE
Teaching a model to distinguish visually similar patterns.
MRI datasets combine different resolutions, anatomical views and acquisition conditions. Tumours may also share location, shape and texture, making the boundary between classes difficult to learn.
The work therefore focused as much on data quality and experimental discipline as on model architecture: combining public datasets, removing samples with insufficient quality, balancing classes and keeping test images outside augmentation.
MENINGIOMA
Tumour arising from the meninges surrounding the brain.
GLIOMA
Tumour originating in glial cells, with highly variable appearance.
PITUITARY
Tumour located around the pituitary gland at the base of the brain.
NO TUMOUR
MRI samples without evidence of the three target tumour classes.
RESEARCH PIPELINE
From raw images to an interpretable prediction.
- DATAPrepare the MRI dataset
Combine public collections, remove unsuitable samples and separate training, validation and test data.
- MODELTrain through transfer learning
Use controlled augmentation and adapt VGG16 visual features to distinguish the four MRI classes.
- OUTPUTEvaluate and deliver predictions
Assess every class and serve probabilities through a Flask application with numerical and visual results.
MODEL EVOLUTION
The first model revealed the problem. VGG16 made it scalable.
An initial CNN covering two classes established the preprocessing and evaluation workflow, but its small dataset produced unstable validation behaviour. Increasing and cleaning the data improved the experiment before expanding it to four classes.
Transfer learning reused VGG16's pretrained visual features. Freezing most of the network and adapting the output reduced the trainable portion to roughly 16,000 parameters for the target classification task.
- INITIAL EXPERIMENTCNN baseline with two classes
A custom network used 620 images to validate the workflow. Unstable validation exposed overfitting and the limits of a small dataset.
- IMPROVING DATASETExpand and strengthen the training input
Multiple public sources were cleaned, reorganised and balanced into a dataset of 5,320 images. Controlled rotations, shifts, zoom and flips then increased variation during training.
- FINE TUNINGAdapt VGG16 to the four MRI classes
Images were standardised to 224 × 224 × 3. Pretrained visual features were retained while the classification output was adapted to the target classes with roughly 16,000 trainable parameters.
- OUTCOMEStronger recognition through richer learning
The larger and more varied input improved model learning, supported more stable generalisation and produced meaningful predictions across four classes.
DATA STRATEGY
More data helped. Better controlled data mattered more.
The final experiment used 5,320 MRI images with balanced class counts. A 70/20/10 strategy separated learning, model selection and final evaluation, while augmentation introduced controlled rotations, shifts, zoom and flips exclusively during training.
OPEN ACADEMIC DATA
Where the MRI images came from.
The research combined publicly accessible MRI collections used for academic experimentation. Images from the different sources were reviewed, reorganised and filtered before entering the common training workflow.
FIGSHAREBrain Tumor Dataset3,064 T1 weighted MRI images with contrast enhancement across three tumour classes. CC BY 4.0.KAGGLEBrain Tumor Classification (MRI)Public academic collection organised around glioma, meningioma, pituitary and images without a tumour.GITHUBBrain Tumor Detection DatasetOpen reference repository containing MRI samples and CNN experimentation material.
EXPERIMENTAL RESULTS
Strong results across classes, with visible room for improvement.
The four class model reached 88.17% training accuracy. Evaluation by class showed that glioma remained the most difficult category, reinforcing the importance of visual similarity and dataset quality.
COMPARISON BY CLASSReference and model accuracy by class
Published targetApplied model
Meningioma+21.38 pp
Glioma-4.16 pp
Pituitary-0.74 pp
No tumourBenchmark not available
FROM MODEL TO PRODUCT
From trained model to functional application.
As part of the study, I developed a web application that connected the trained Keras model to a Python and Flask backend. Users could submit an MRI image and receive probabilities across four classes, presented numerically and through D3.js visualisations. This demonstrated how the research model could support a practical review workflow.
To demonstrate the complete inference workflow, a pituitary MRI sample was submitted to the application. The report records the selected image, the probability assigned to each class and the final classification returned by the model.
========================================
MRI CLASSIFICATION REPORT
========================================

INPUT DATA
FILE............. pituitary (654).png
INPUT TYPE....... MRI IMAGE
MODEL OUTPUT..... FOUR CLASSES

PREDICTION SCORES
MENINGIOMA....... 0.007176
NO TUMOUR........ 0.000283
GLIOMA........... 0.051178
PITUITARY........ 0.941363

PRIMARY CLASSIFICATION
LABEL............ PITUITARY
CONFIDENCE....... 94.1363%

REPORT STATUS.... COMPLETE
END OF REPORT
========================================
PREDICTION DISTRIBUTION
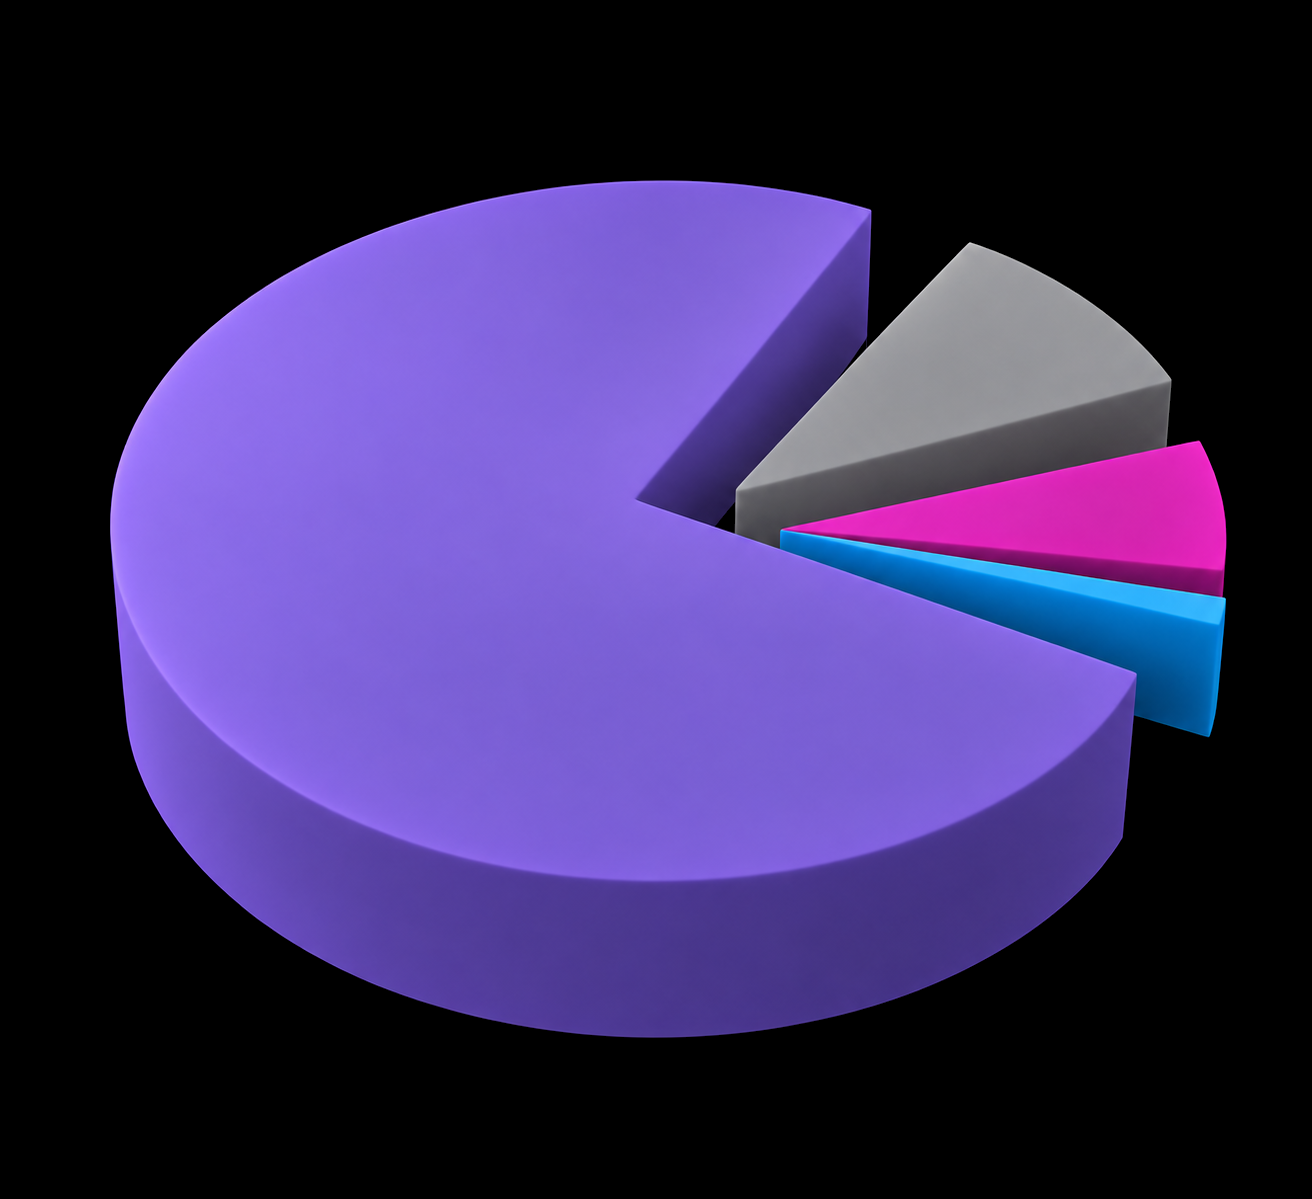
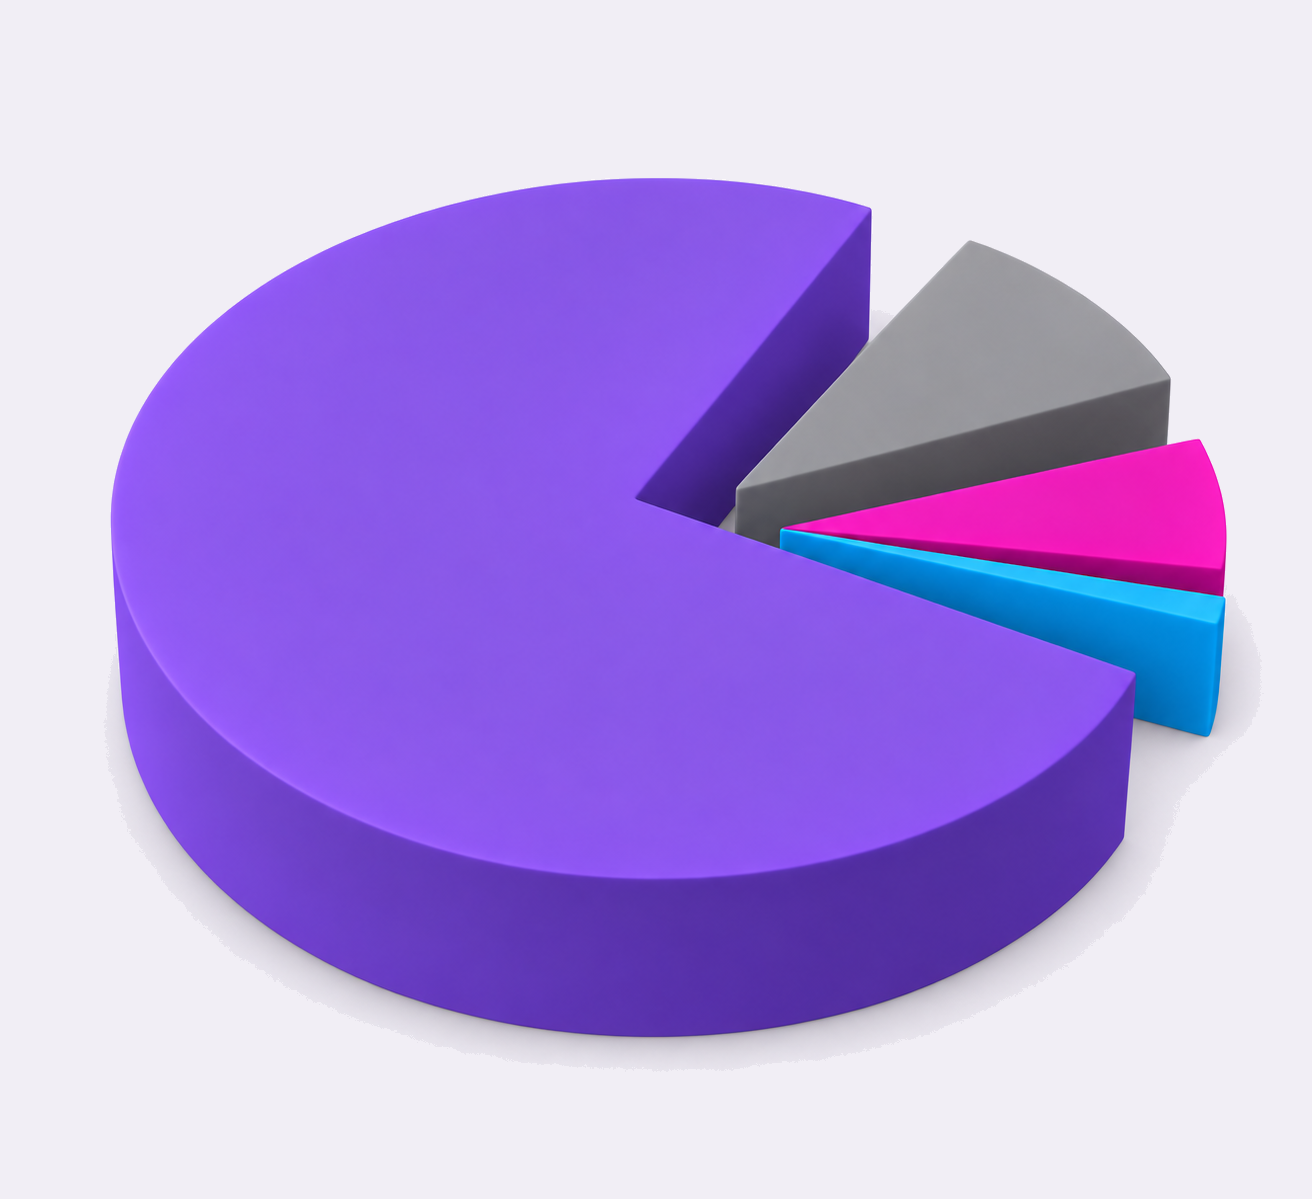
Pituitary94.1363%
Glioma5.1178%
Meningioma0.7176%
No tumour0.0283%
RESPONSIBLE RESEARCH · TECHNICAL FOUNDATION
A complete workflow with a clear clinical boundary.
The stack connected model development, accelerated experimentation, backend inference and browser visualisation within one complete workflow. It remains a research prototype designed to support experimentation and cannot replace diagnosis by qualified medical professionals.